set.seed(42)

hist(rnorm(1000),freq = FALSE,ylim = c(0,.4),
     breaks = 10,col = "steelblue",main = "Histogram of Normal distribution")
lines(density(rnorm(1000)),col="blue",lwd=2)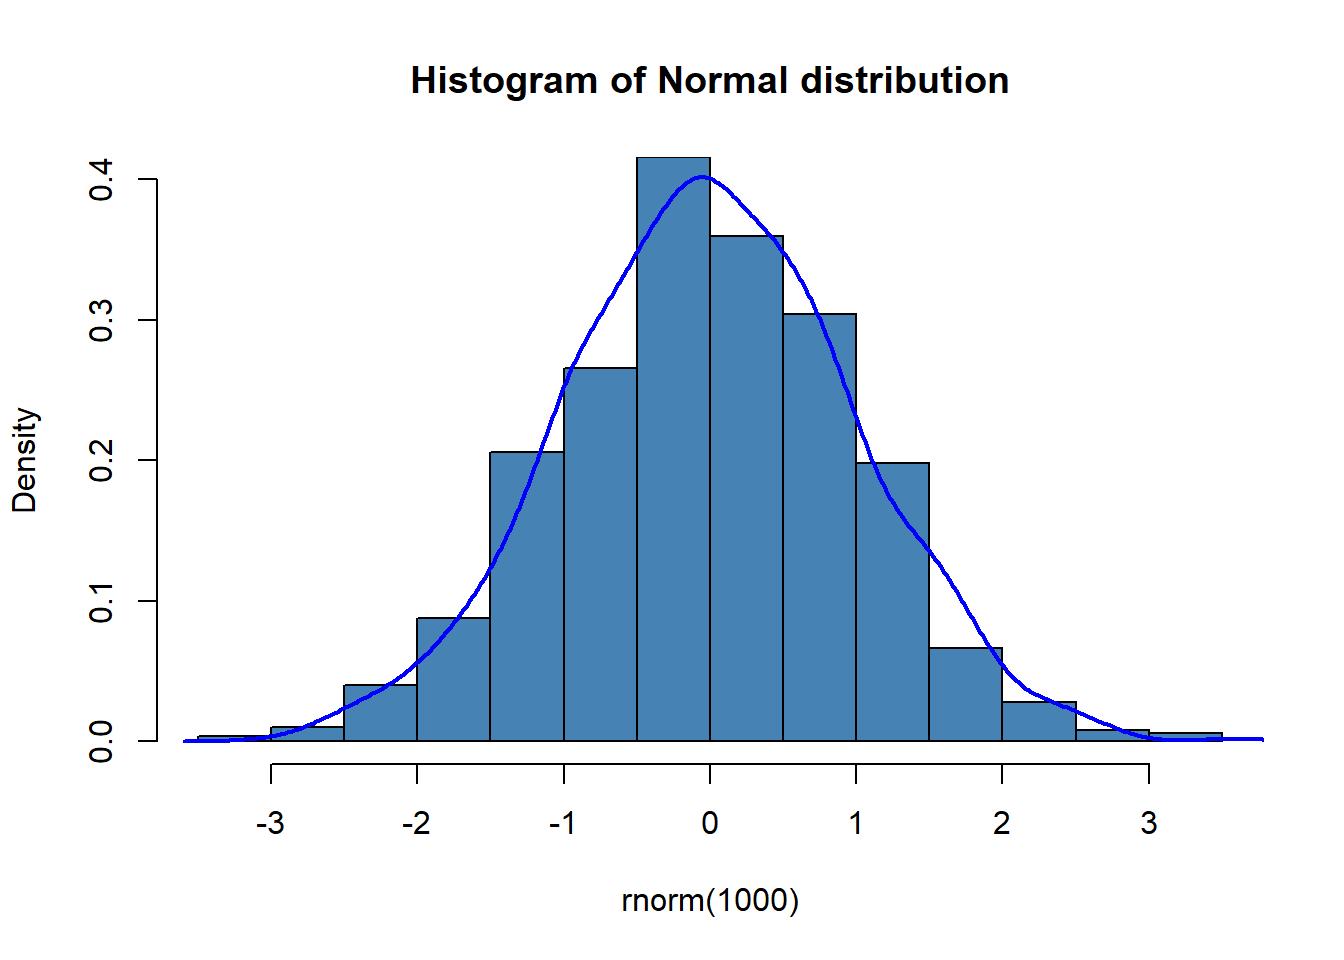
When events are happened simultaneously, to explore the relationship between two random variables we need joint probability distributions.
Definition
set.seed(42)
hist(rnorm(1000),freq = FALSE,ylim = c(0,.4),
breaks = 10,col = "steelblue",main = "Histogram of Normal distribution")
lines(density(rnorm(1000)),col="blue",lwd=2)import seaborn as sns
import matplotlib.pyplot as plt
import numpy as np
#import pandas as pd
# Generate 1000 samples
seed = 42
n_rv = np.random.normal(loc=0, scale=1, size=1000)
#print(n_rv)
#plt.clf() # Clears the current figure
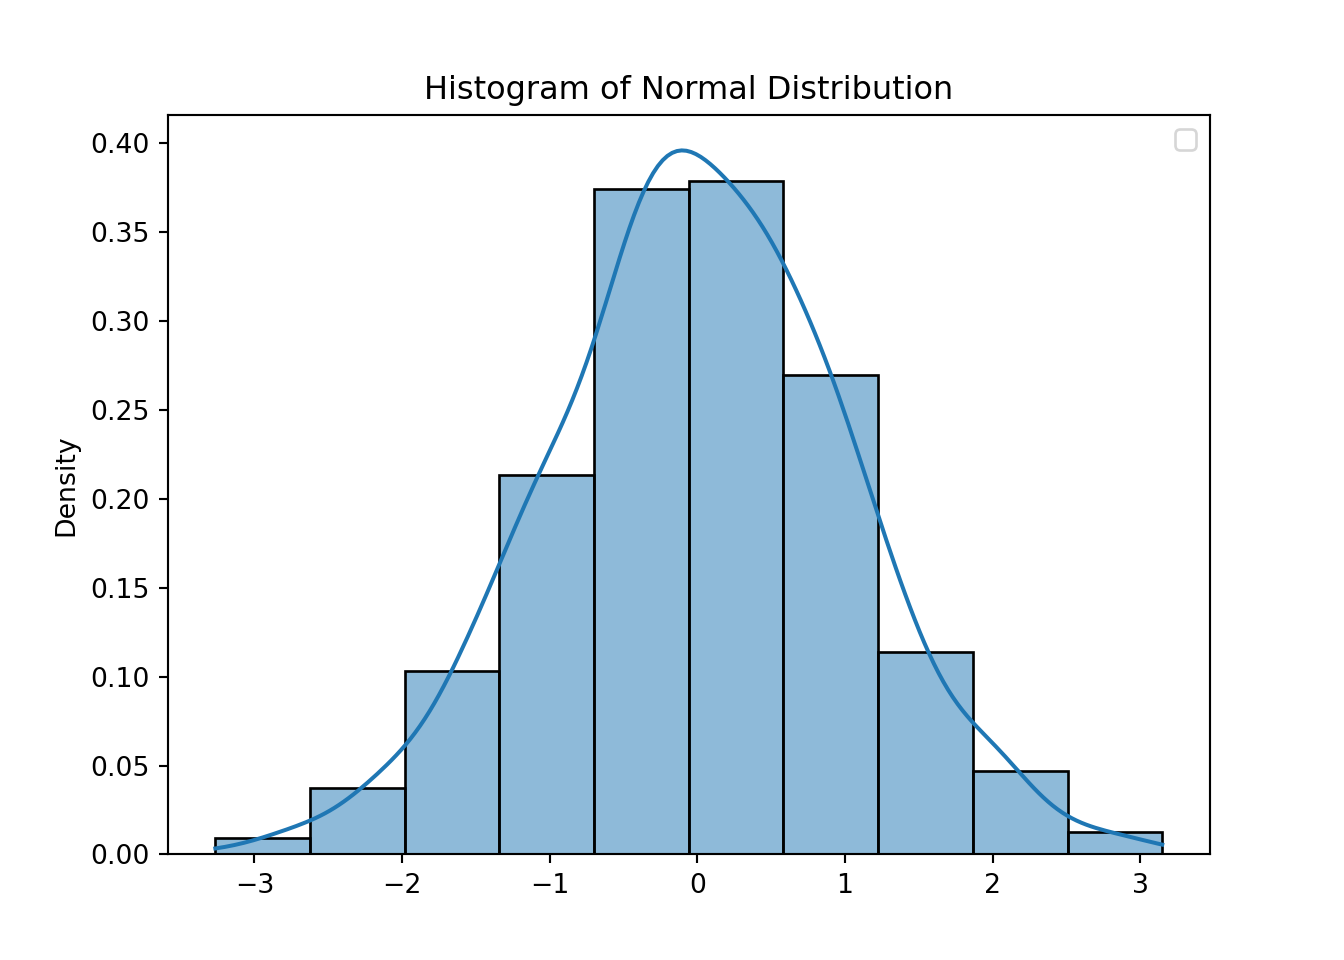
## Using `seaborn`
sns.histplot(n_rv, kde=True,stat="density",bins=10)
plt.title("Histogram of Normal Distribution")
plt.legend()
plt.show()